Embedded Development Board Learning
Tool for Measuring CPU Time in Embedded Systems
Fecha: junio 1, 2024
Autor: Guillermo Garcia
Categorías: RTOS Etiquetas: Development tools
I recall a time when someone asked me about the performance of a project, specifically how long a certain process took. At that moment, my response was, What does it matter if my code works and the project seems to do what is requested?.
Since then, I realized that understanding the time each process takes in an embedded system is crucial to truly understanding your system and identifying situations where it might not meet timing requirements, especially when working with an RTOS and managing multiple processes.
The question arises: how can we estimate the time the CPU spends on certain tasks to optimize our system effectively? In this article, I will introduce two tools that have helped me measure the time it takes for the CPU to complete a series of tasks.
Table of Contents
Simple Methods for Measuring CPU Time in Embedded Systems
The methods presented in this article do not require sophisticated tools. While a J-Link debugger is indeed a sophisticated tool, it remains indispensable.
The first method is quite straightforward, as it only requires a logic analyzer preferably an affordable one.
The second method, however, requires more setup time and a J-Link debugger, along with SEGGER SystemView software. Once configured, this method becomes more convenient and powerful. With just a few lines of code, you can track various tasks effectively.
Tool for Measuring with Logic analyzer
This classic technique, while not the most precise, is far better than guessing how long the CPU spends on processes that seem to take little time or, worse, not knowing how long repetitive tasks take. This is especially important when working in a real-time operating system (RTOS) environment where meeting deterministic timing is crucial.
Let’s measure how long it takes to send a string via UART. The time for this can vary depending on peripheral configuration, system clock frequency, and microcontroller specifications.
First, configure a GPIO as an output by toggling its state from HIGH to LOW right in the middle of the UART transmission process.
Connect the logic analyzer to the GPIO to capture the state change. The logic analyzer will not provide the exact time but will help in measuring the duration.
void vTask(void* ptrValue)
{
	char msg[] = "DBL\n";

	while(1)
	{
		HAL_GPIO_WritePin(OUTPUT_LED_GPIO_Port, OUTPUT_LED_Pin, GPIO_PIN_SET);
		HAL_UART_Transmit(&huart1, (const uint8_t*)msg, strlen(msg), 500);
		HAL_GPIO_WritePin(OUTPUT_LED_GPIO_Port, OUTPUT_LED_Pin, GPIO_PIN_RESET);

		SEGGER_SYSVIEW_PrintfTarget("Log Time");
		vTaskDelay(5/portTICK_PERIOD_MS);
	}
}
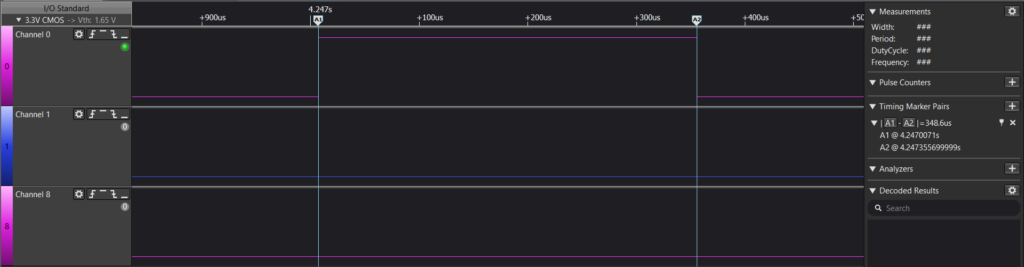
Let’s see this from the logic analyzer we get 348.6 us.
Efficient Debugging with SEGGER SystemView
Tool for Measuring requires more initial setup but is more practical and allows for more agile debugging. In this article, we won’t cover how to configure SystemView on your MCU. However, you can find excellent guides on configuring SystemView, such as the one provided by SEGGER.
Once SystemView is configured, you need to set it up to measure events as follows.
SEGGER_SYSVIEW_NameMarker(0, "Time 0");
Once registered, we can identify it with the ID for this case 0. To start the measurement we only need to indicate the start and end of the process that we want to measure in this way.
void vTask(void* ptrValue)
{
	char msg[] = "DBL\n";
    SEGGER_SYSVIEW_NameMarker(0, "Time 0");

	while(1)
	{
		SEGGER_SYSVIEW_MarkStart(0);
		HAL_UART_Transmit(&huart1, (const uint8_t*)msg, strlen(msg), 500);
        SEGGER_SYSVIEW_MarkStop(0);

		SEGGER_SYSVIEW_PrintfTarget("Log Time");
		vTaskDelay(5/portTICK_PERIOD_MS);
	}
}
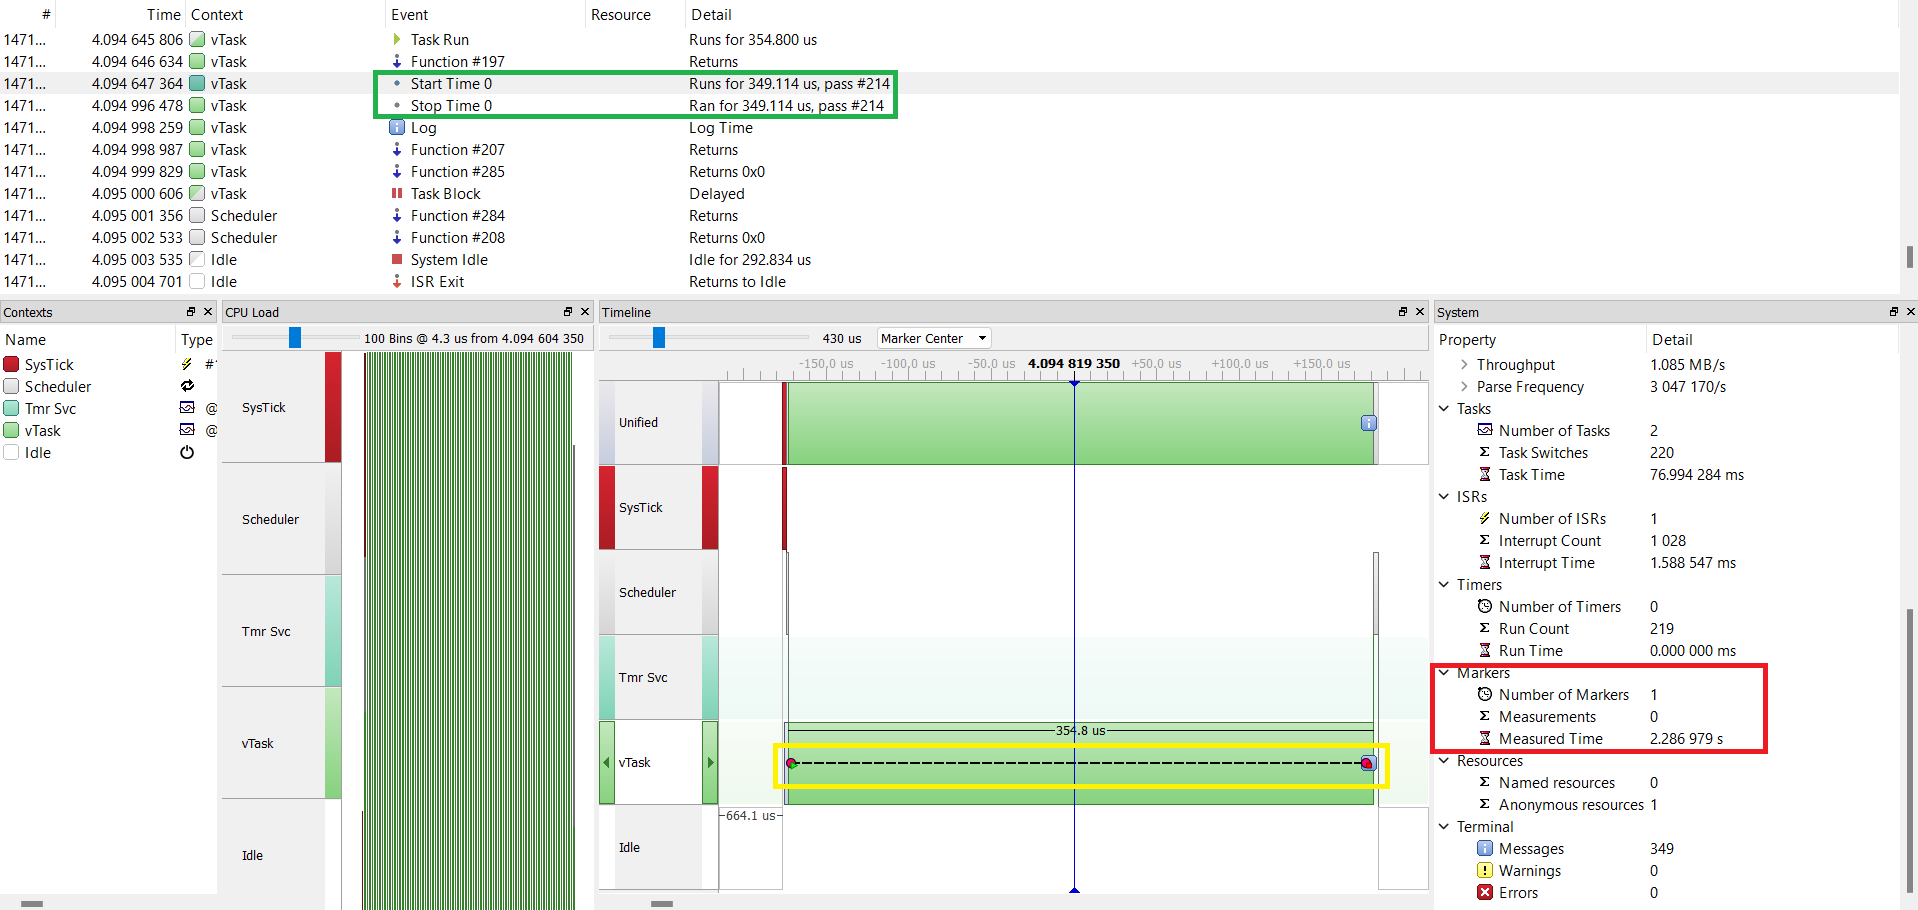
Let’s look at the trail of events.

- In the green box we see the time from the start to the end of the process: 349.114 us.
- In the red box we can see the number of timestamps recorded; for this example we only have one.
- We can also see a line drawn from the start to the end of the process, which is shown in the yellow box.
These types of tools are very important when working in real-time operating system RTOS environments, if you are new to this topic you can review the FreeRTOS series that we created from scratch to advanced.
Comentarios... no existen comentarios.
Subscribe

Deja una respuesta