Embedded Development Board Learning
Visual Studio Code for ARM with CMake #1 Installing Tools
Date: enero 2, 2023
Author: Guillermo Garcia
Categories: Visual Studio Code Tags: Development tools
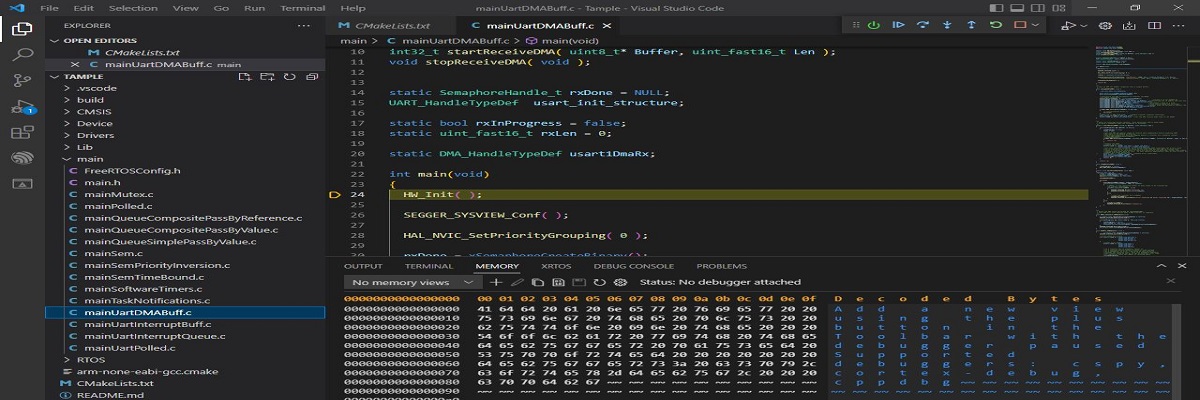
We begin this series of articles where we will set up everything needed to use the Visual Studio Code editor as an embedded software development environment. Why do we do this when we have countless complex IDEs that offer various development platforms?
One of the advantages is that we can use this environment for different platforms and development kits based on the ARM architecture. Therefore, we will build a universal development environment.
Part of the flexibility is that we can add only the tools we truly need; sometimes, it is true when they say that less is more.
Table of Contents
What do we need ?
Our main code editor will be Visual Studio Code, but this platform by itself cannot compile our C code. To compile, we will use the Arm GNU Toolchain, which includes the GCC-based compiler with support for C and C++.
Now that we know which compiler we are going to use, we need a tool that calls the compiler and specifies which files from our project should be included in the compilation process. For this, we will install a tool called CMake, due to the flexibility it provides in managing the build process. If we switch MCU platforms, we only need to change a couple of variables, and CMake will call the compiler properly.
For now, let’s not worry about CMake we will have an article in this series dedicated to understanding how it works.
We also need to install GNU Make to handle the process of invoking the compiler, and we will go into more detail about this throughout the series.
How do we communicate with the MCU? Well, for this we need a debugger. To make this platform-independent, we will use a J-Link debugger, which means we also need to install the J-Link software.
Can we debug code from Visual Studio Code? Yes, there is a debug adapter in the code editor, but, as expected, it is not compatible with embedded software development. For this, we will need an adapter that bridges compatibility between our J-Link debug hardware and the debug controller in the code editor.
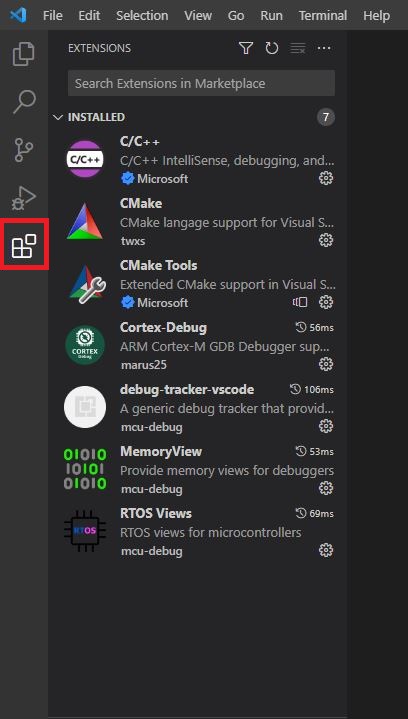
Luckily, this adapter exists and was developed as an extension called Cortex Debug. We will see how to add this extension to our code editor.
Installing Visual Studio Code
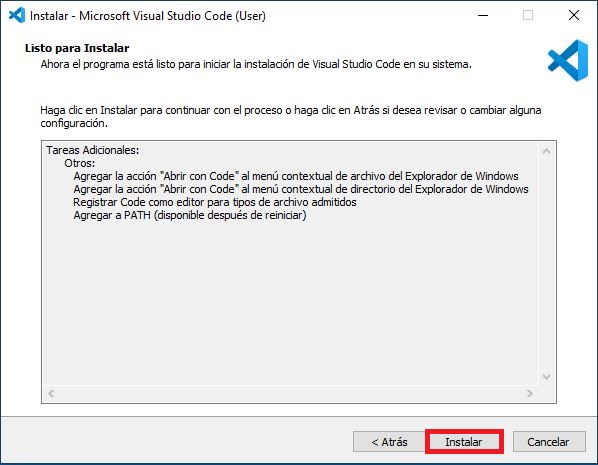
We download the Visual Studio Code installer in my case, the installer for the Windows operating system. We run the installer and follow the steps as we would with any other installation.
Once installed, we open the code editor and go to the extensions section to install the necessary extensions for debugging and uploading code to the MCU.
Installing the GCC Compiler
Let’s continue with the installation; it’s time for the compiler, which is a fundamental part of the development environment. We download the installer for the GCC compiler. I will be working with version 10.3.
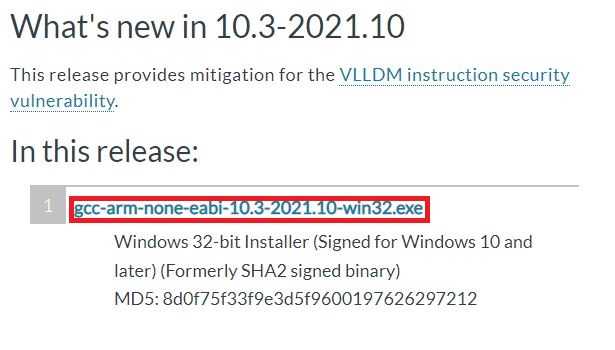
We run the installer, in my case, for the Windows operating system.
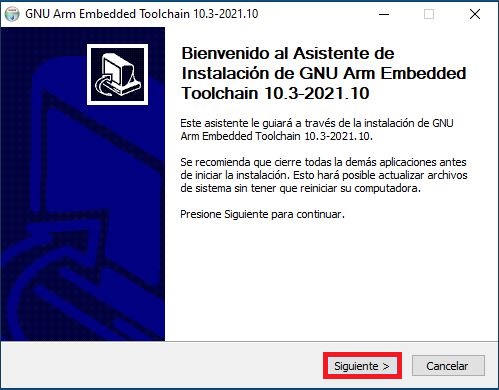
Let’s validate that the installation is correct on our system. To do this, we invoke the compiler using the Windows command prompt cmd.
C:\Users\dbl_>arm-none-eabi-gcc --version
arm-none-eabi-gcc (GNU Arm Embedded Toolchain 10.3-2021.10) 10.3.1 20210824 (release)
Copyright (C) 2020 Free Software Foundation, Inc.
This is free software; see the source for copying conditions.  There is NO
warranty; not even for MERCHANTABILITY or FITNESS FOR A PARTICULAR PURPOSE.
Installing CMake
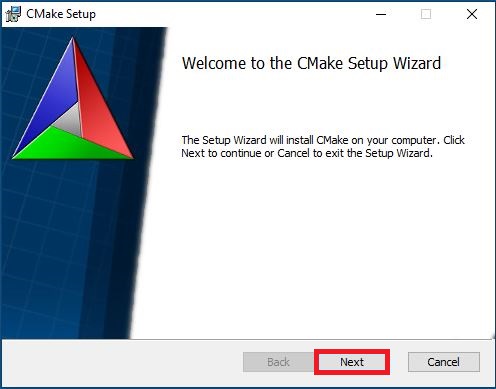
We go to the CMake website to download the installer for Windows and follow the steps.
Installing GNU Make
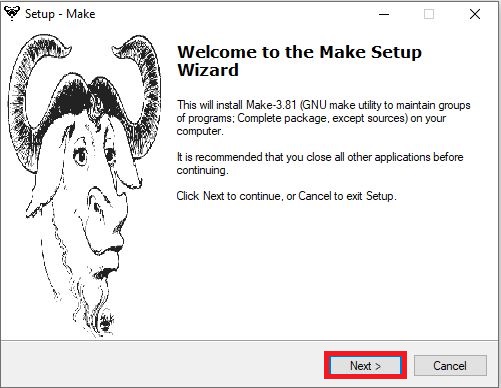
The Windows operating system does not come with GNU Make installed by default, as is the case with Linux. We will download a port and utilities to use Make from the GnuWin website.
Installing SEGGER J-Link
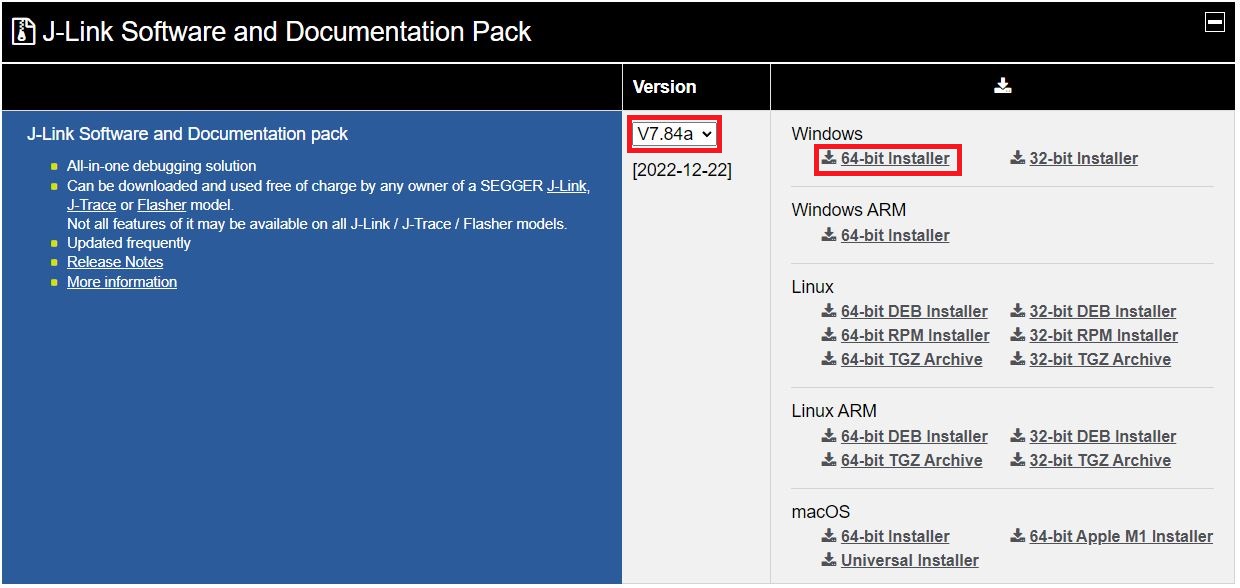
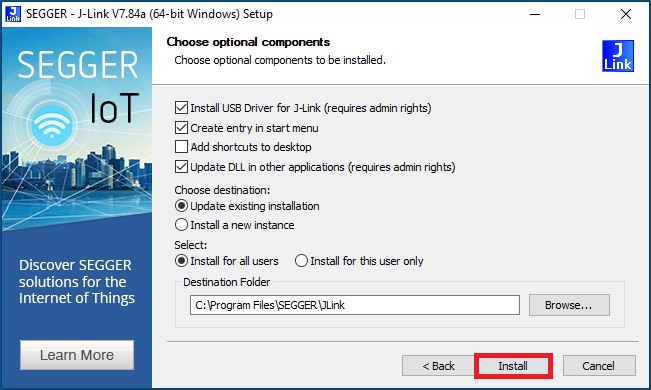
Now let’s install the software package for the J-Link debugger. We go to the SEGGER website, choose the version, and download the installer.

Deja una respuesta